Stanford Named Entity Recognizer (NER) to Google Map Engine

This is a first effort at using the Stanford Named Entity Recognizer to extract locations from an Internet Archive text file and use the geocoding capabilities of the Google Map Engine to identify the top 99 locations in the text. I relied a lot on William Turkel’s NER lesson and it will take some work to streamline and hopefully automate the process for a future Geospatial Historian lesson. You can find a number of errors in the map, but it is a good sign that the majority of the locations extracted from The Gazetteer of Scotland (1882) are concentrated in Scotland and this does provide a potentially quick method to visualize the most frequent locations in a text.

Plant Diseases in the 19th Century

tropical_disease_word_cloud
A word cloud of diseases found in The Diseases of Tropical Plants by Melville Thurston Cook

During the 19th century British industrialists and botanists searched the world for economically useful plants. They moved seeds and plants between continents and developed networks of  trade and plantations to supply British industries and consumers. This global network also spread diseases. Stuart McCook is working on the history of Coffee Rust (Hemileia Vastatrix) and there are a few books that examine the diseases that prevented Brazil from developing rubber plantations. Building on this work, we’re using the Trading Consequences text mining pipeline to try explore the wider trends of plant diseases as they spread through the trade and plantation network.

We need a list of diseases with both the scientific and common names from the time period. The Internet Archive provides a number of text books from the end of the 19th and start of the 20th century. They were written by American botanists, but one book in particular attempts a global survey of tropical plant diseases (The Diseases of Tropical Plants). Because these books are organized in an encyclopedic fashion, it is relatively easy to have a student go through and create a list of plant disease. We’re  working on expanding our list from other sources of the next few weeks. Once the list is complete we’ll add them to our pipeline and extract relationships between mentions of these diseases, locations, dates and commodities in our corpus of 19th century documents. This should allow us to track Sooty Mould, Black Rot, Fleshy Fungi, Coffee Leaf Rust and hundreds of other diseases at points in time when they became enough of a problem to appear in our document collection.


The Giant Cost of Past Pollution

Originally published on ActiveHistory.ca

Mine_Building_Giant_Mine_Yellowknife_Northwest_Territories_Canada_12

Some historical artifacts pose a dangerous and costly challenge to those of us living today and to future generations. Unlike stone ruins, carefully preserved books or dusty archival papers, the toxic waste produced by past industrial activities contaminate environments around the world, threatening our health and our economic future. Here in Canada, a review board just released a report on how to clean up the “237,000 tonnes of highly toxic arsenic trioxide dust stored in 15 underground chambers” that remained after the closing of Giant Mine in Yellowknife  (CBC). The outlook is grim. The clean up will costs up to one billion dollars, but will not provide a permanent solution to freeze the toxic waste in place. Because current technologies can not safely remove the arsenic, the report requires further research and a reassessment every twenty years until a permanent solution is found. Giant Mine was an economic success story, which extracted 220,000 kg of gold in a little more than half a century of mining , but also left behind a costly and dangerous toxic legacy.

Coal-location-date relationships text mined from Early Canada Online (Canadiana.ca)

This video displays some new data from the Trading Consequences project (@digtrade). We use the Edinburgh Geoparser to added lat/long data for all of the locations found in the corpus. We then extract the relationship between a lexicon of commodities, in this case coal, and geogrounded location (i.e. when we find coal and a place name in the same sentence). Currently we use the publication date, but hope to text mine more precise dates in the near future. Finally, we use ArcGIS’s new time function to create a video showing the geography of coal mentions changing over time in the corpus. We’ve also added a density “heat map” showing the regions of the world where coal is mentioned most often over the whole of the long-nineteenth century.

Guest Post on Kew Gardens’ Blog

Bea Alex, Uta Hinrichs and myself have written a guest post, “Bringing Kew’s Archive Alive” for Kew Gardens’ Library, Art and Archives’ blog.

The post looks at how digital data produced by Kew’s Directors’ Correspondence team can be used as a source for visualising the British Empire’s 19th Century trade networks.

You can read the post in full here: http://www.kew.org/news/kew-blogs/library-art-archives/bringing-kews-archive-alive.htm

Here is one of the videos I created for the blog post:

Bringing Kew’s Archive alive from Jim Clifford on Vimeo.

Ten Most Frequent Letter Writers in the Kew Garden Directors’ Correspondence

I’ve been informed that my original download missed a lot of the files. I’m going to recreated the two graphs below over the next few days with the missing data and rework this post.

top10

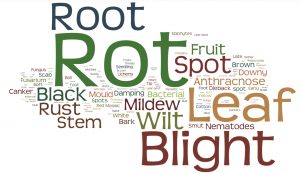
I’m working with Bea Alex on a blog post for the Kew Garden Directors’ Correspondence project. They shared their meta data collection with Trading Consequences and Bea reformatted it into a directory of 7438 xlm files (one for every letter digitized to date by the project). The metadata includes all the information found on the individual letter webpages (sample). Bea and the rest of the team in Edinburgh focused on extracting commodity-place relationships from the description field. We’re currently working with the data for coffee, cinchona, rubber, and palm to create an animated GIS time-map for the blog post we are writing. However, because this is one of the smallest collections we are processing in the Trading Consequences project, I decided to try and play around with the data a little more.

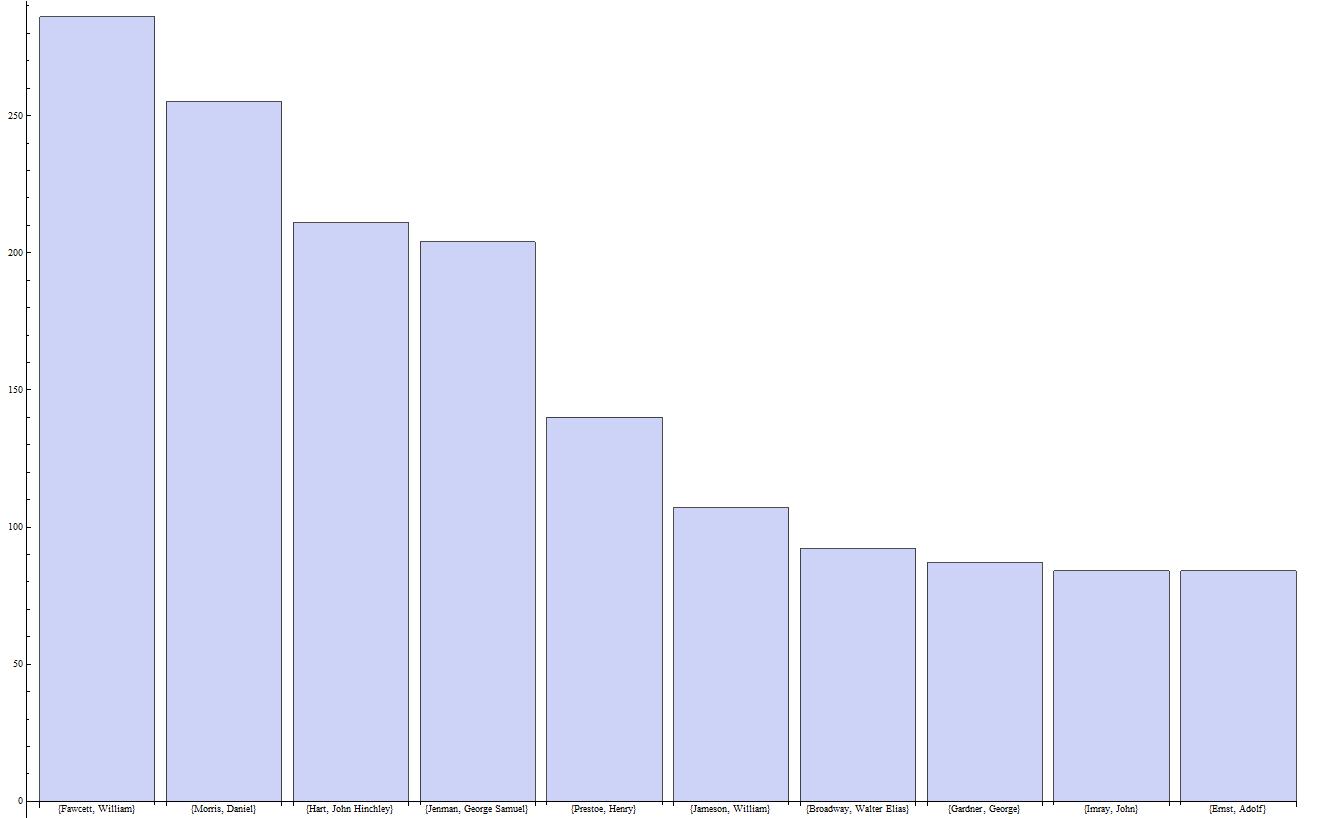
XML files are pretty ubiquitous once you start working with large data sets. They are generally easier to read and more portable than standard relational databases and presumably have numerous other advantages. The syntax is familiar if you know HTML, but I’ve still found it challenging to learn how to pull information out of these files. As with most things, coding in Mathematica, instead of Python, makes it easier. It turned out to be relatively straight forward to import all 7438 xml files, have Mathmatica recognize the pattern of the “Creator” field and pull out a list of all of the letter authors. From there, it was easy to tally up the duplicates, sort them in order of frequency (borrowing a bit of code from Bill Turkel) and graph the top ten (of the 1689 total authors).