Category: Maps
London’s Text-Mined Hinterlands for the Social Science History Association
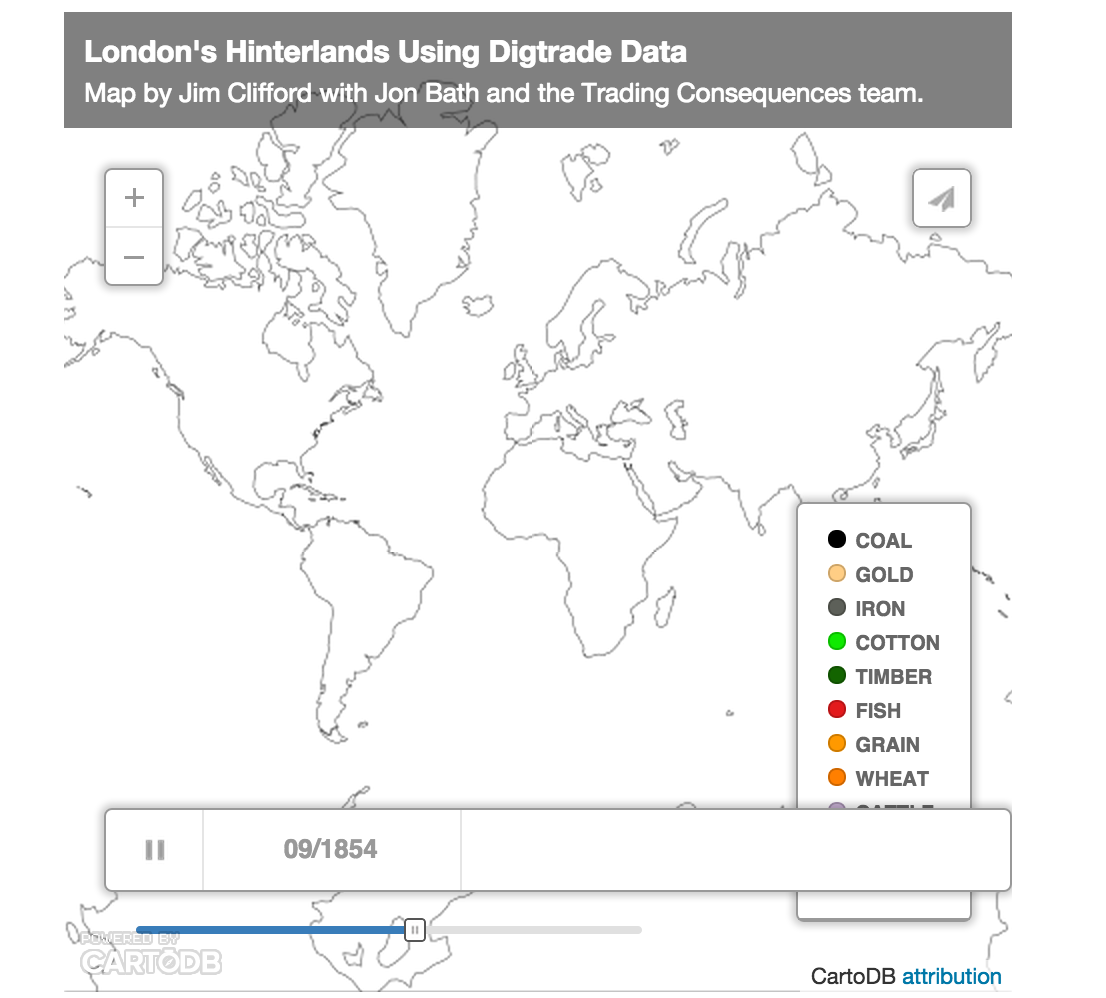
The map below visualizes the text-mined data produced by the Trading Consequences project. We queried the database to identify all the commodities with a strong relationship to London and then found every other location where the text mining pipeline identified a relationship those commodities at least 10 times in a given year. This results in 111,977 rows of data, each representing between 2841 and 10 commodity-place relationships. I will present this data visualization to the Social Science History Association meeting in Toronto this November.
The map above uses CartoDB’s Torque Cat animation to visualize the data as it changes over time. It only distinguishes 10 different commodities, which is already too many to really follow, and displays the remaining commodities in the Other category. The word cloud below shows all of the commodities and ranks them by the number of places and number of years they met the 10 relationships threshold (i.e. the words are bigger if a commodity had a lot of mined relationships with different places and these relationships remained consistent across the whole century).
It is also possible to look at all of the data from the whole of the nineteenth century to see the the locations with a high intensity of relationships with numerous commodities that also have a strong relationship with London.
[This map looks better when you zoom in.]
I should note that this data does not confirm a direct relationship with London and not all of these locations are a part of the city’s increasingly global hinterlands. Some locations would be competing markets sourcing the same materials or producing the same goods as London. British ports were also waystations where goods from the world were transhipped and sent on to other European centres. The text mining identified when a commodity term, like sugar, was in the same sentence as a place name. The text mining shows a strong correlation between London and sugar and a strong correlation between Cuba and sugar. In this case Cuba, I know from other sources, it was among the numerous suppliers of sugar to London. We cannot simply assume, however, that the strong correlation between Leather and Calais in 1822 meant the French port supplied London with Leather in that year. They could be a market for London’s leather or a competitor. To focus the map on London’s hinterlands exclusively, I would need to filter out results based on additional research and an extensive ground-truthing exercise. It would probably be more accurate to say these maps helps illuminate the geography of commodities related to London in the nineteenth century, but this data and the visualizations remain a starting point for further research (like the research I’m doing with Andrew Watson on leather).
You can download the data as a CSV file with this link.
Here is the abstract for the SSHA paper I’m co-authoring with Bea Alex and Uta Hinrichs:
Visualizing Text Mined Geospatial Results: Exploring the Trading Consequences Database.
Text Mining 19th Century Place Names
By Jim Clifford
Nineteenth century place names are a major challenge for the Trading Consequences project. The Edinburgh Geoparser uses the Geonames Gazetteer to supply crucial geographic information, including the place names themselves, their longitudes and latitudes, and population data that helps the algorithms determine which “Toronto” is most likely mentioned in the text (there are a lot of Torontos). Based on the first results from our tests, the Geoparser using Geonames works remarkably well. However, it often fails for historic place names that are not in the Geonames Gazetteer. Where is “Lower Canada” or the “Republic of New Granada“? What about all of the colonies created during the Scramble for Africa, but renamed after decolonization? Some of these terms are in Geonames, while others are not: Ceylon and Oil Rivers Protectorate. Geonames also lacks many of the regional terms often used in historical documents, such as “West Africa” or “Western Canada”.
To help reduce the number of missed place names or errors in our text mined results, we asked David Zylberberg, who did great work annotating our test samples, to help us solve many of the problems he identified. A draft of his new Gazetteer of missing 19th century place names is displayed above. Some of these are place names David found in the 150 page test sample that the prototype system missed. This includes some common OCR errors and a few longer forms of place names that are found in Geonames, which don’t totally fit within the 19th century place name gazetteer, but will still be helpful for our project. He also expanded beyond the place names he found in the annotation by identifying trends. Because our project focuses on commodities in the 19th century British world, he worked to identify abandoned mining towns in Canada and Australia. He also did a lot of work in identifying key place names in Africa, as he noticed that the system seemed to work in South Asia a lot better than it did in Africa. Finally, he worked on Eastern Europe, where many German place names changed in the aftermath of the Second World War. Unfortunately, some of these location were alternate names in Geonames and by changing the geoparser settings, we solved this problem, making David’s work on Eastern Europe and a few other locations redundant. Nonetheless, we now have the beginnings of a database of place names and region names missing from the standard gazetteers and we plan to publish this database in the near future and invite others to use and add to it. This work is at an early stage, so we’d be very interested to hear from others about how they’ve dealt with similar issues related to text-mining historical documents.
Stanford Named Entity Recognizer (NER) to Google Map Engine
This is a first effort at using the Stanford Named Entity Recognizer to extract locations from an Internet Archive text file and use the geocoding capabilities of the Google Map Engine to identify the top 99 locations in the text. I relied a lot on William Turkel’s NER lesson and it will take some work to streamline and hopefully automate the process for a future Geospatial Historian lesson. You can find a number of errors in the map, but it is a good sign that the majority of the locations extracted from The Gazetteer of Scotland (1882) are concentrated in Scotland and this does provide a potentially quick method to visualize the most frequent locations in a text.
GIS and Time
[This is my first post for The Otter since I passed on the editorial duties to Josh MacFadyen in the summer]
One of the major weaknesses in using GIS for historical research are the limitations in showing change over time. GIS was designed with geography in mind and until recently historians needed to adapt the technology to meet our needs.  Generally this meant creating a series of maps to show change overtime or as Dan MacFarlane did last week, include labels identifying how different layers represent different time periods. More recently, ArcGIS and Quantum GIS introduced features to recognize a time field in data and make it possible to include a time-line slider bar or animate the time series data in a video.
19th Century Changes in the British Tallow Supply
Tallow, fat rendered from sheep and cows, was a major ingredient in soap and candles. While large amounts of animal fats were collected locally from butchers and household waste, Britain imported between £500,000 to £2,500,000 worth of tallow a year between the 1870s and 1890s. This equaled more than twenty-one thousand tons a year in the mid-1780s, increasing to over forty thousand tons in the late 1860s and surpassing a hundred thousand tons a year in the late 1890s.
During the late 18th century the vast majority of the tallow came from Russia. Based on the limited sources I’ve found so far, it appears that some of this tallow originated as sheep grazing on the Kazakh Steppe on the eastern edge of the Russian Empire, while the rest of it was a by-product of Russia’s domestic livestock market. These sheep were rendered near Orenburg and then the tallow traveled vast distances overland to Arkhangelsk, before it was shipped to Britain. I would love to learn about more sources to better understand the Russian side of this trade.
British Tallow Imports 1784-1786 (Total imports: £517,000)
The Russians remained dominant through to the mid-19th century. During the second half of the 19th century the Russian trade collapsed and was replaced by the United States, South America and Australasia. I am still looking into the causes of this dramatic shift, but in general it demonstrates the instability brought on by the globalization of this industrial supply chain. The other factor missing from these maps is the increased importance of palm and coconut oil in soap and candle making. (The maps represent the percentage of the total value of imports from each region.)